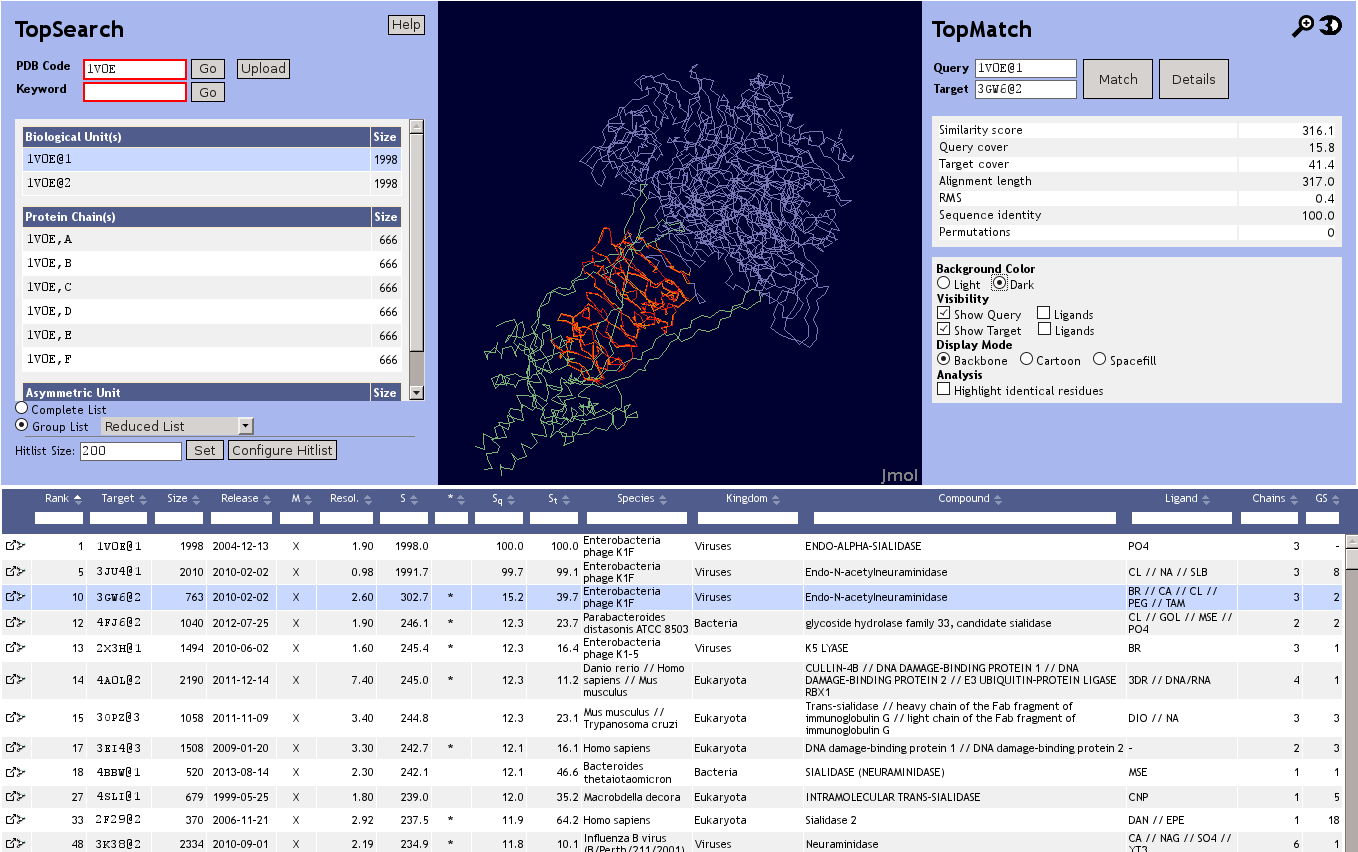
TopSearch is a new powerful gateway to protein structures and their structural relationships. Given a query structure the search engine instantly returns a list of known protein structures sorted by structural similarity. TopSearch operates on three structural levels: chains, biological assemblies/quaternary structures (yes, including ribosomes!), and asymmetric units. All at the same speed! In working with structures, numbers are not enough - with TopSearch you see what you get. Immediately!
System Requirements
TopSearch requires Java to run the Jmol plugin. Due to this platform independent setup, TopSearch should run on most operating systems as well as on all common browsers. If you experience any trouble using TopSearch, please feel free to contact us.
Overview
To get more information about the various functions of TopSearch, please click on the respective area in the screenshot:
Input
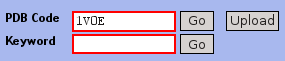
Usually, the input for TopSearch will be a four letter PDB code. Alternatively, it is possible to upload a structure in PDB file format or to perform a full text search of the database, e.g. with a protein function or the name of an enzyme.
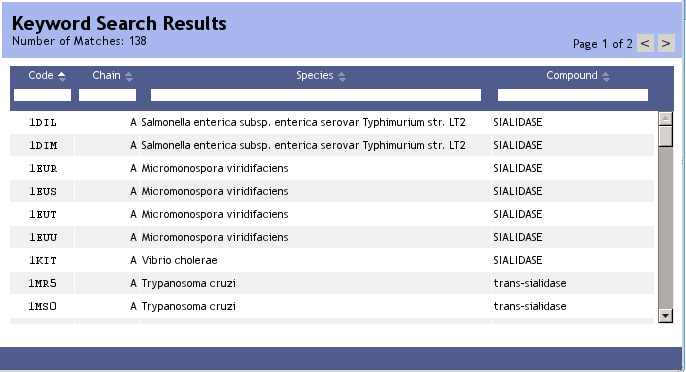
After a full text search you can pick any PDB chain in the result table and start to explore its nearest neighbors. For any PDB code, TopSearch provides several selectable structural entities (see next section).
Selection
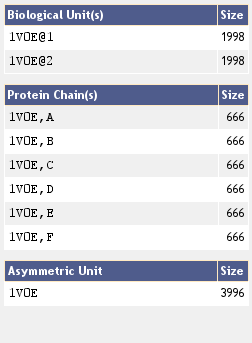
After hitting the Enter key or clicking on the Go button, TopSearch will present you with several options to generate a nearest neighbor list. Essentially, you can search on three different layers of structural organisation:
- Biological Unit(s)
- All biological units (biological assemblies) that are defined in the PDB file. Each biological assembly is denoted with an @i (i being an integer) following the PDB code.
- Protein Chain(s)
- All protein chains defined in the PDB file.
- Asymmetric Unit (or PDB file)
- Complete PDB file. In case of X-ray structures, this represents the unique part of a crystal structure. In case of NMR structures, the first model is used.
The nearest neighbor search is launched by clicking on any of the protein structural entities.
The Nearest Neighbor List
After clicking on a structural entity, the TopSearch webpage will display a list containing the most similar proteins sorted by structural similarity to the query protein. Additionally the Jmol widget will show you the structure of the selected entity.
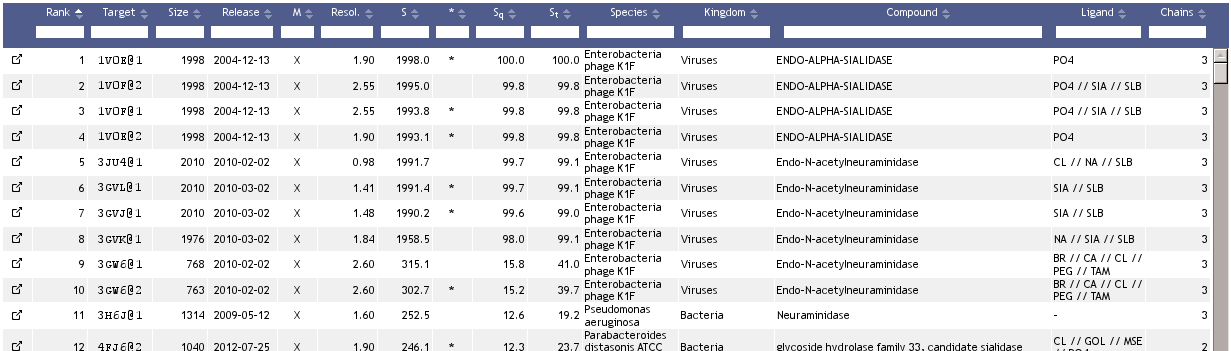
The list is ordered by a similarity score, S, which combines the number of aligned residues derived from the respective structure alignment with the distance between each two paired residues (see below).
Table Columns
The hitlist table has the following columns:
- Rank
- The rank of the entry in the result list.
- Target
- The access code of the entry; depends on the selected protein structure unit.
- Size
- Number of residues in the target structure.
- Release
- Date on which the protein structure was released by the PDB.
- M
- One letter code for the experimental method that was used to solve the protein structure.
- Resol.
- Resolution of the protein structure in Ångström.
- S
- Structural similarity between query and target. Similarity is quantified by a score of structural similarity based on Gaussian functions (see Sippl & Wiederstein (2012)). If the structurally equivalent parts in query and target match perfectly, S is equal to the length of the structure alignment. With increasing spatial deviation of the aligned residues, S approaches 0.
- *
- A '*' symbol in this column indicates that the value of S is estimated.
- Sq
- Query cover based on similarity score S, expressed in percent.
- St
- Target cover based on similarity score S, expressed in percent.
- Species
- The scientific name of the organism which the protein was derived from.
- Kingdom
- Bacteria, Archaea, Eukaryota, or Viruses.
- Compound
- Compound information of the PDB file. Usually a short description of the function/molecule name for each chain. For multiple chains, the compound terms are separated by "//".
- Ligand
- List of ligands (abbreviated) in the structure. Multiple ligands are separated by "//".
- Chains
- Number of chains the structure consists of.
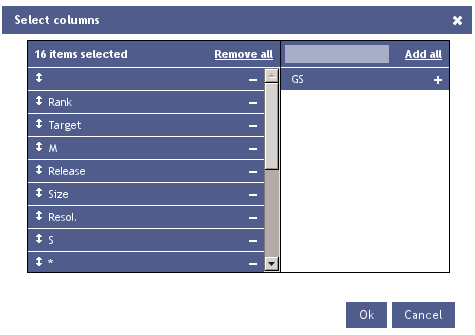
Additionally it is possible to add/remove or reorder columns using the Configure Hitlist option.
Sorting by Table Columns
To examine the hit list more efficiently, it is possible to sort
the list by clicking on the list headers.
By clicking on the header of any column again, the current mode of sorting
is reversed.
Note that only the results visible in the current hitlist will be filtered.
Complete List / Group List
TopSearch offers a simple filtering option with the Complete List / Group List radio buttons on top of the nearest neighbor list. By default, the filter is switched off, i.e. a complete result list is displayed. The Group List option keeps only one entry (the "representative") from a group of structurally similar targets. Several ways of filtering are available: The Reduced List option removes targets that have at least 90% sequence similarity AND at least 90% structure similarity to any other target. Several other options (L30,...,L99) allow to remove redundancy on different levels of structural similarity.
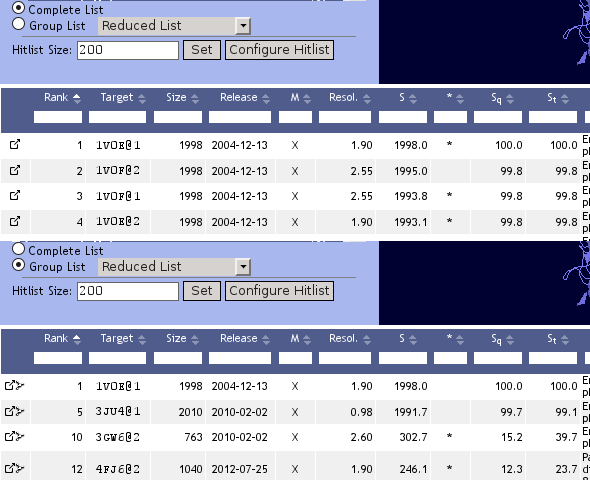
By clicking on the tree icon the members of a group can be analyzed in detail in TopTree
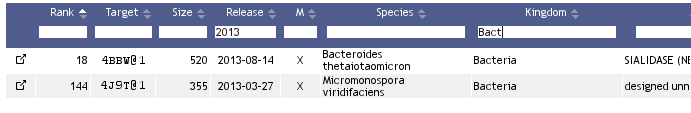
Searching in Topsearch Results
Sometimes it might be convenient to be able to search for specific
PDB codes, organisms, kingdoms, etc. in the hit list. TopSearch offers a simple
search tool that enables the user to find PDB codes in the current
hit list page.
Entering a search term into the white input box located under each column
header restricts the results to entries that contain the specified term.
By using search term for multiple columns it is possible to retrieve results
matching all given criteria.
Note that only the results visible in the current hitlist will be sorted.
Therefore, sorting by reverse similarity will give the 200th entry at the
top of the list.
Links to External Resources
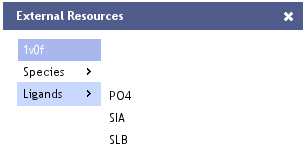
Links
- PDB Code
- Link to the PDB summary page for the selected entry's PDB code.
- Species
- Link to the NCBI Taxonomy for the selected entry's species.
- Ligands
- Link to the PDB Ligand entry for the selected entry's ligand.
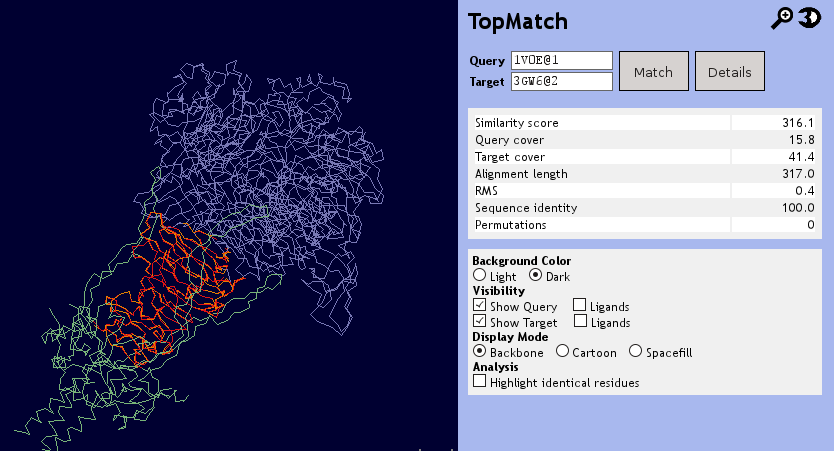
Superimpose two structures
To visualize the query's superposition with any entry in the result list, just click on the respective row in the list. The Jmol widget will then show the superposition and additional data that characterize the alignment as calculated by the TopMatch program. You can align any two entries in the list by entering or dragging their codes into the TopMatch widget.
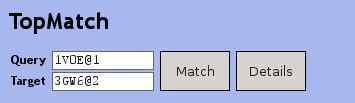
The TopMatch widget offers two buttons:
- Match, which shows the superimposition in the Jmol widget
- Details, which opens a new TopMatch-web window every time you click on it
The Jmol widget
The Jmol widget is used to visualize protein structures and their superpositions. When a structural entity is selected by clicking on it, the respective nearest neighbor list is generated and the entity is shown in the Jmol widget. If chains are selected, the whole asymmetric unit is displayed and the selected chain is colored blue, the rest of the structure is shown in gray.
The structural superposition shows query and target superimposed. The query is colored in blue, the target in green. Aligned residues are colored in orange (query) or red (target). The widget can be enlarged by clicking on the magnifying glass to examine the structure and its superposition in more detail or viewed in stereographic mode bmy clicking on the 3D icon. Query and target can selectively be hidden to facilitate the analysis. Furthermore, the Jmol widget is capable of displaying ligands and highlighting sequence identities in the structure alignment.
References
Wiederstein, M., Gruber, M., Frank, K., Melo, F. and Sippl, M.J. (2014) Structure-Based Characterization of Multiprotein Complexes. Structure 20, 1063-1070. [view]
Berman, H. M. et al. (2000). The Protein Data Bank. Nucleic Acids Research. 28, 235–242. [view]
Sippl M. J. (2009). Fold Space Unlimited. Current Opinion in Structural Biology. 19:312-320. [view]
Sippl M. J. (2008). On distance and similarity in fold space. Bioinformatics 24, 872-873. [view]
Sippl M. J. and Wiederstein, M. (2012). Detection of correlations in protein structures and molecular complexes. Structure 20, 718-728. [view]
Suhrer S., Wiederstein M., Gruber M. and Sippl M. J. (2009). COPS — a novel workbench for explorations in fold space. Nucleic Acids Research. 37:W539-W544. [view]